Observability & DevOps Tooling
The Grafana-based monitoring and alerting layer behind how we run production, not just build it
About this project
Software that ships without a way to see how it's actually behaving in production is only half-built, and alongside product engineering, TieTech builds and operates the observability layer behind our own deployments to prove it. That means Grafana dashboards for service health, request throughput, latency percentiles, and infrastructure resource usage the metrics that tell you something is wrong before a user has to report it plus alerting views built for on-call response, error budget tracking, and deploy correlation, so a bad release is caught and traced back to its cause quickly. This is representative tooling pulled from our DevOps and SRE practice, built to demonstrate how we approach monitoring as a discipline, not a writeup of a single client engagement.
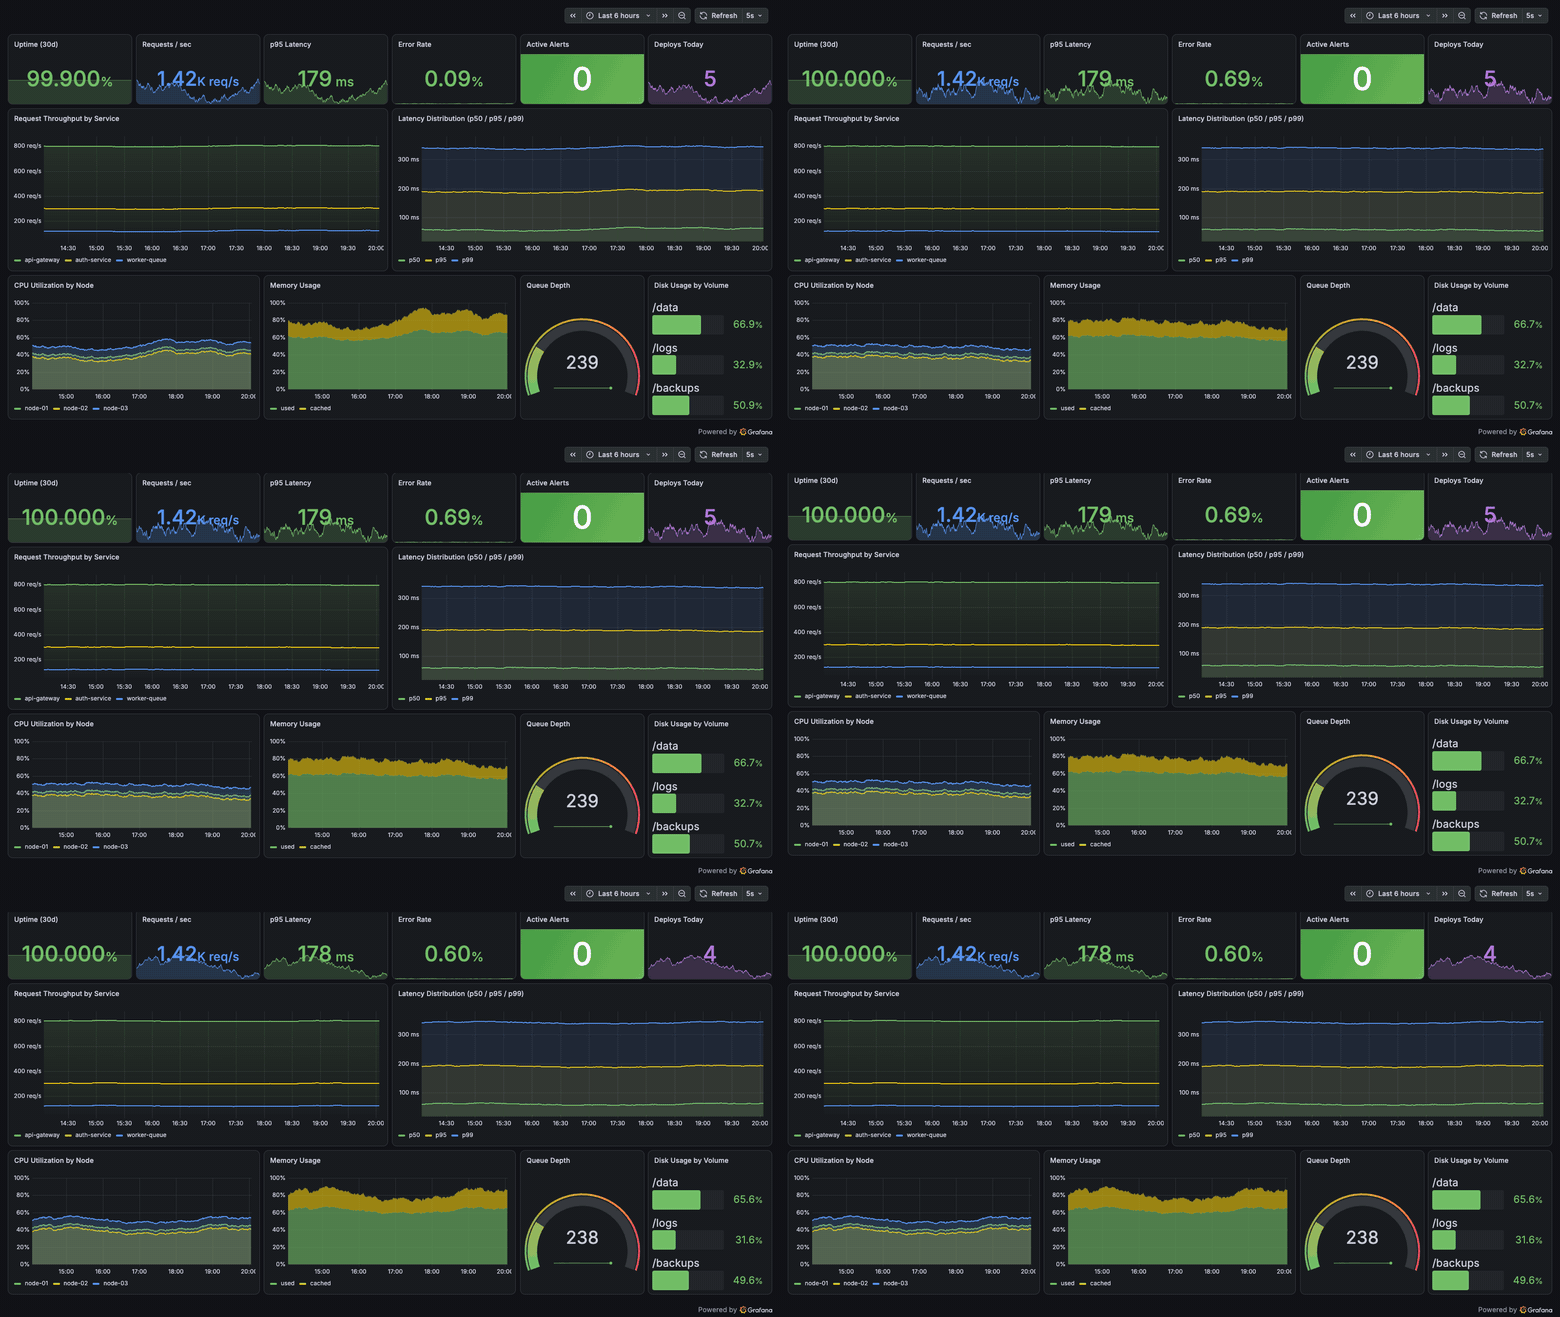
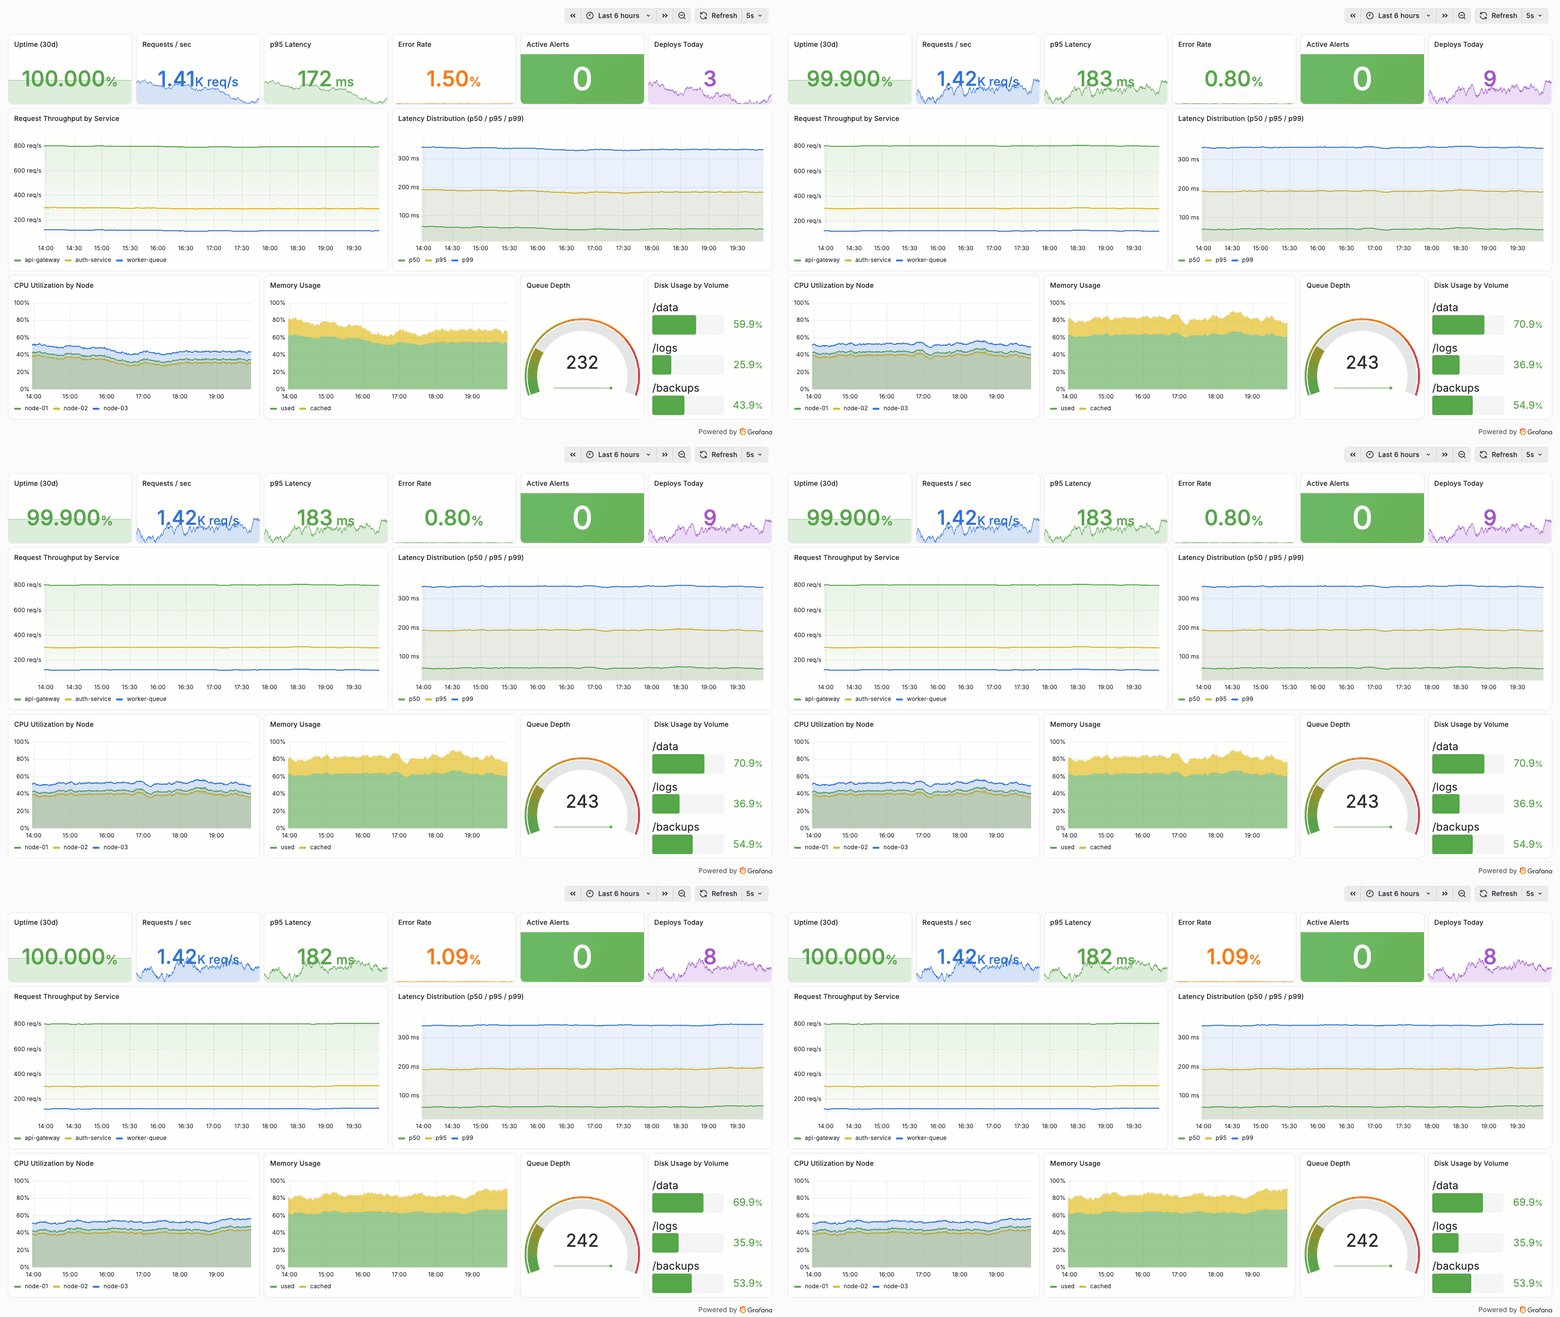
Production Service Health Dashboard
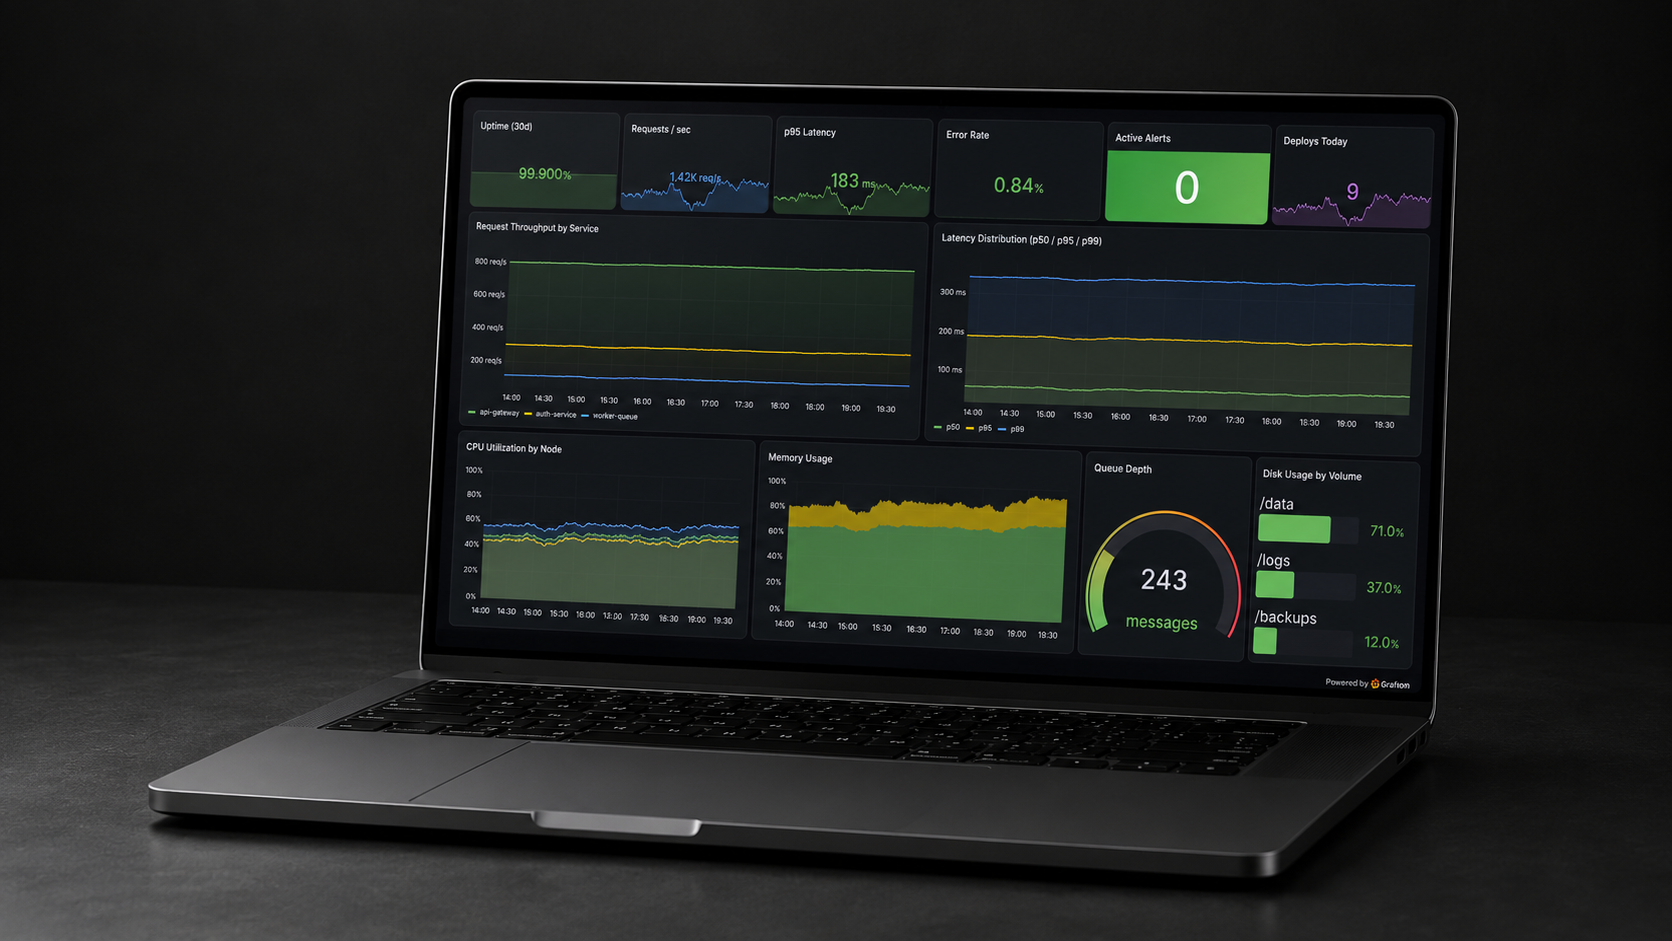
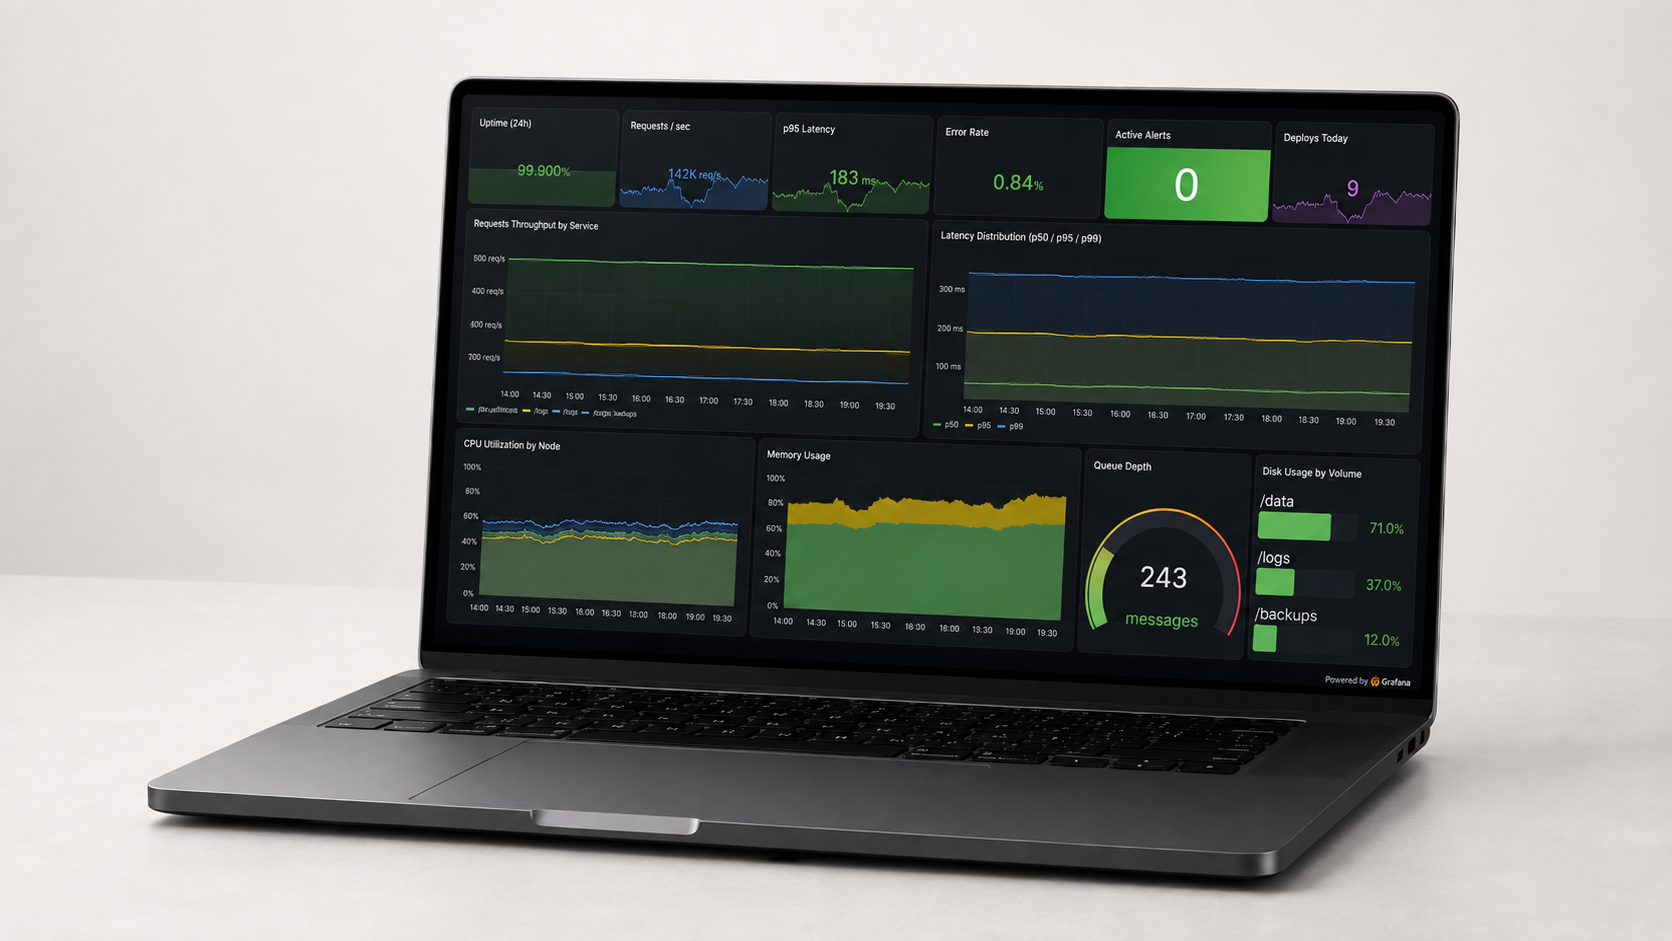
Real-time visibility into request throughput, latency percentiles, error rates, CPU and memory utilization, and disk usage across nodes, so degradation is caught before it reaches users.
- Live request throughput and p50 / p95 / p99 latency by service
- Per-node CPU, memory, and queue depth tracking
- Uptime, error rate, and deploy count at a glance
- Disk usage by volume with threshold-based coloring
Alerting & Incident Overview
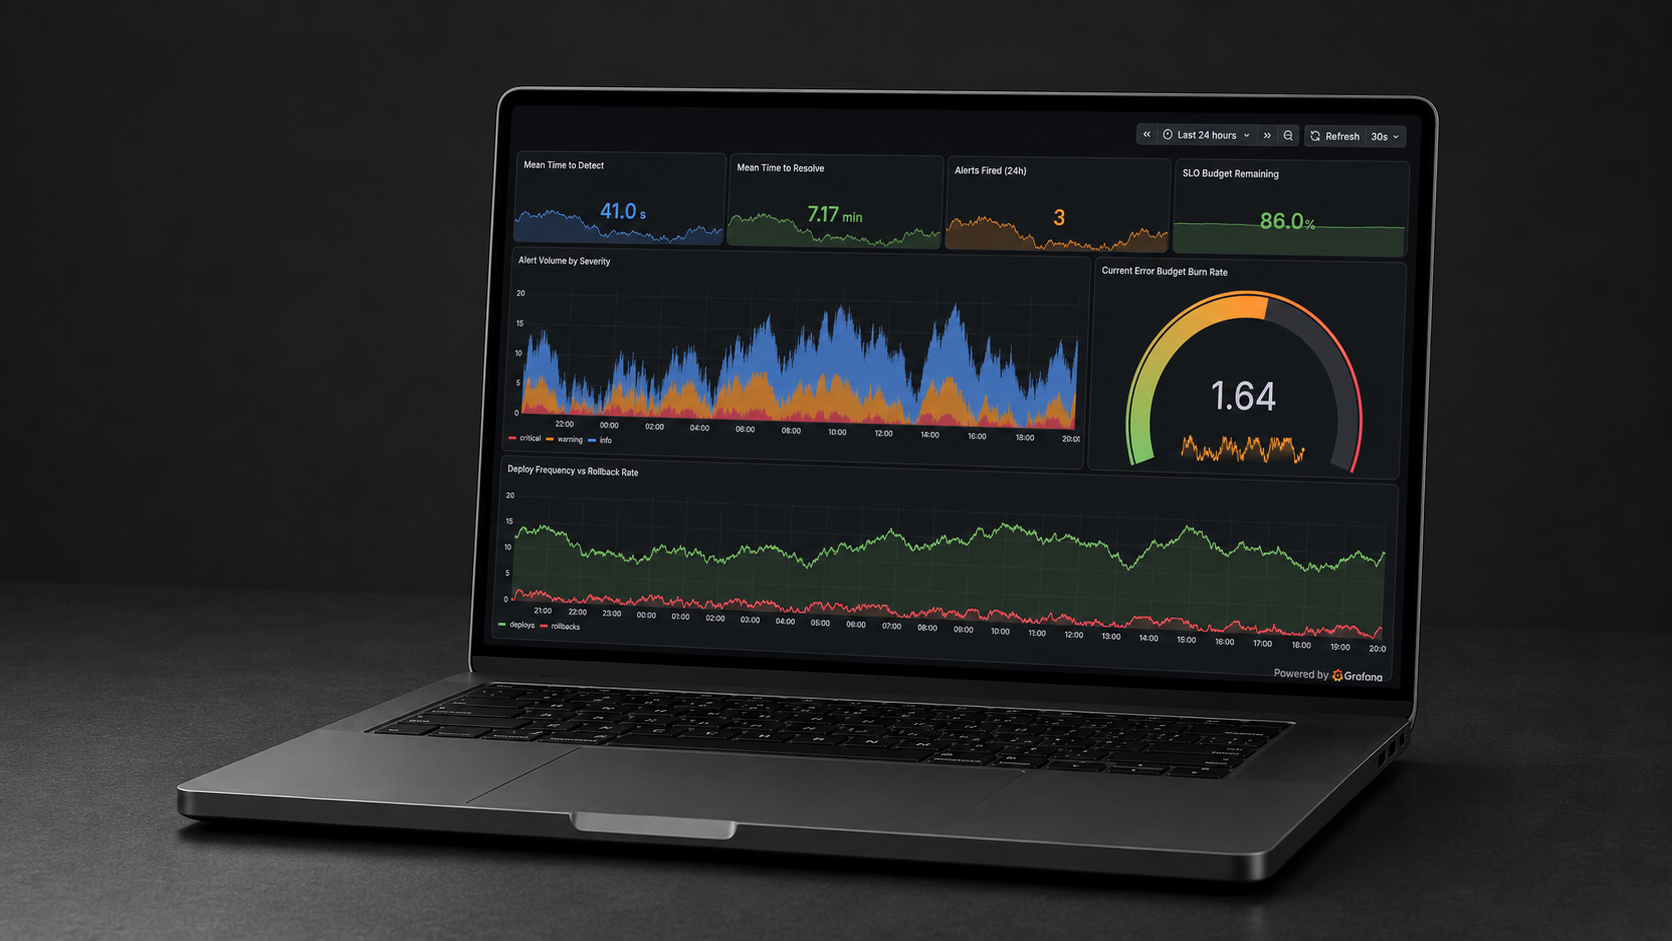
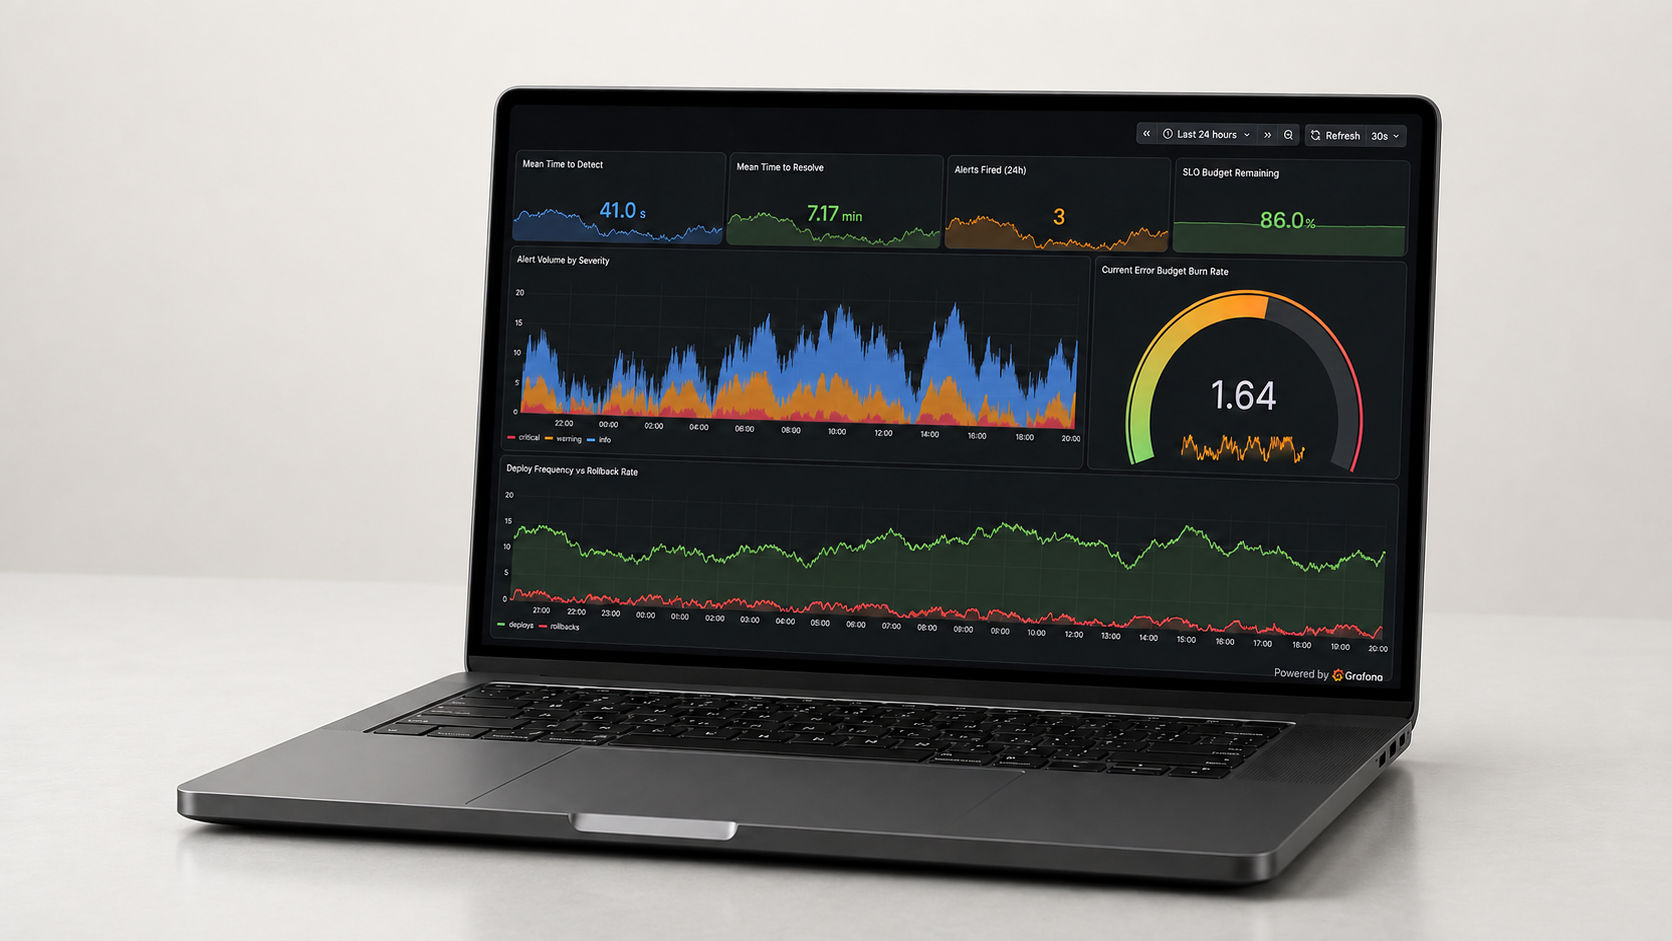
A second dashboard focused on how incidents are detected and resolved: mean time to detect and resolve, alert volume by severity, error budget burn rate, and deploy-to-rollback correlation, giving on-call engineers the context they need without digging through logs first.
- Mean time to detect and mean time to resolve, tracked over time
- Alert volume broken down by critical, warning, and info severity
- SLO budget remaining and current error budget burn rate
- Deploy frequency plotted against rollback rate to catch risky releases early
Dashboards That Update in Real Time
Every panel is backed by a live data source, not a static export, so metrics tick over in front of whoever's watching, the same way they would during an actual incident or deploy.
These dashboards use synthetic data to demonstrate our observability and DevOps practice they are not pulled from a live client environment.