Grafana
Dashboards that catch degradation before a user reports it
What It Is
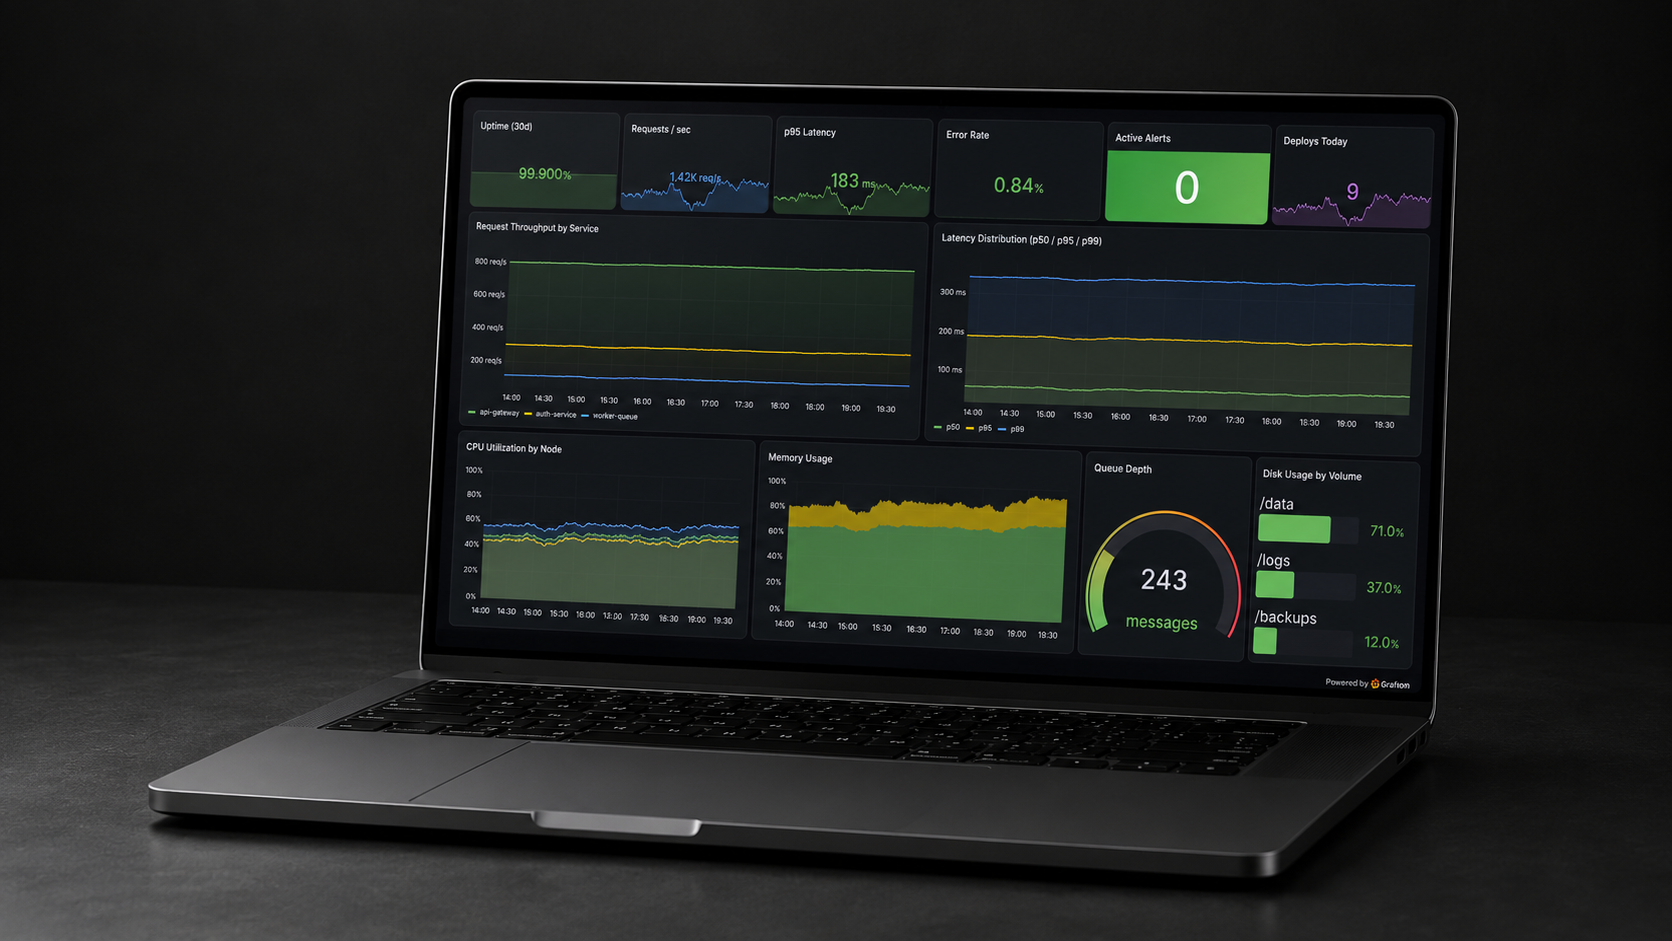
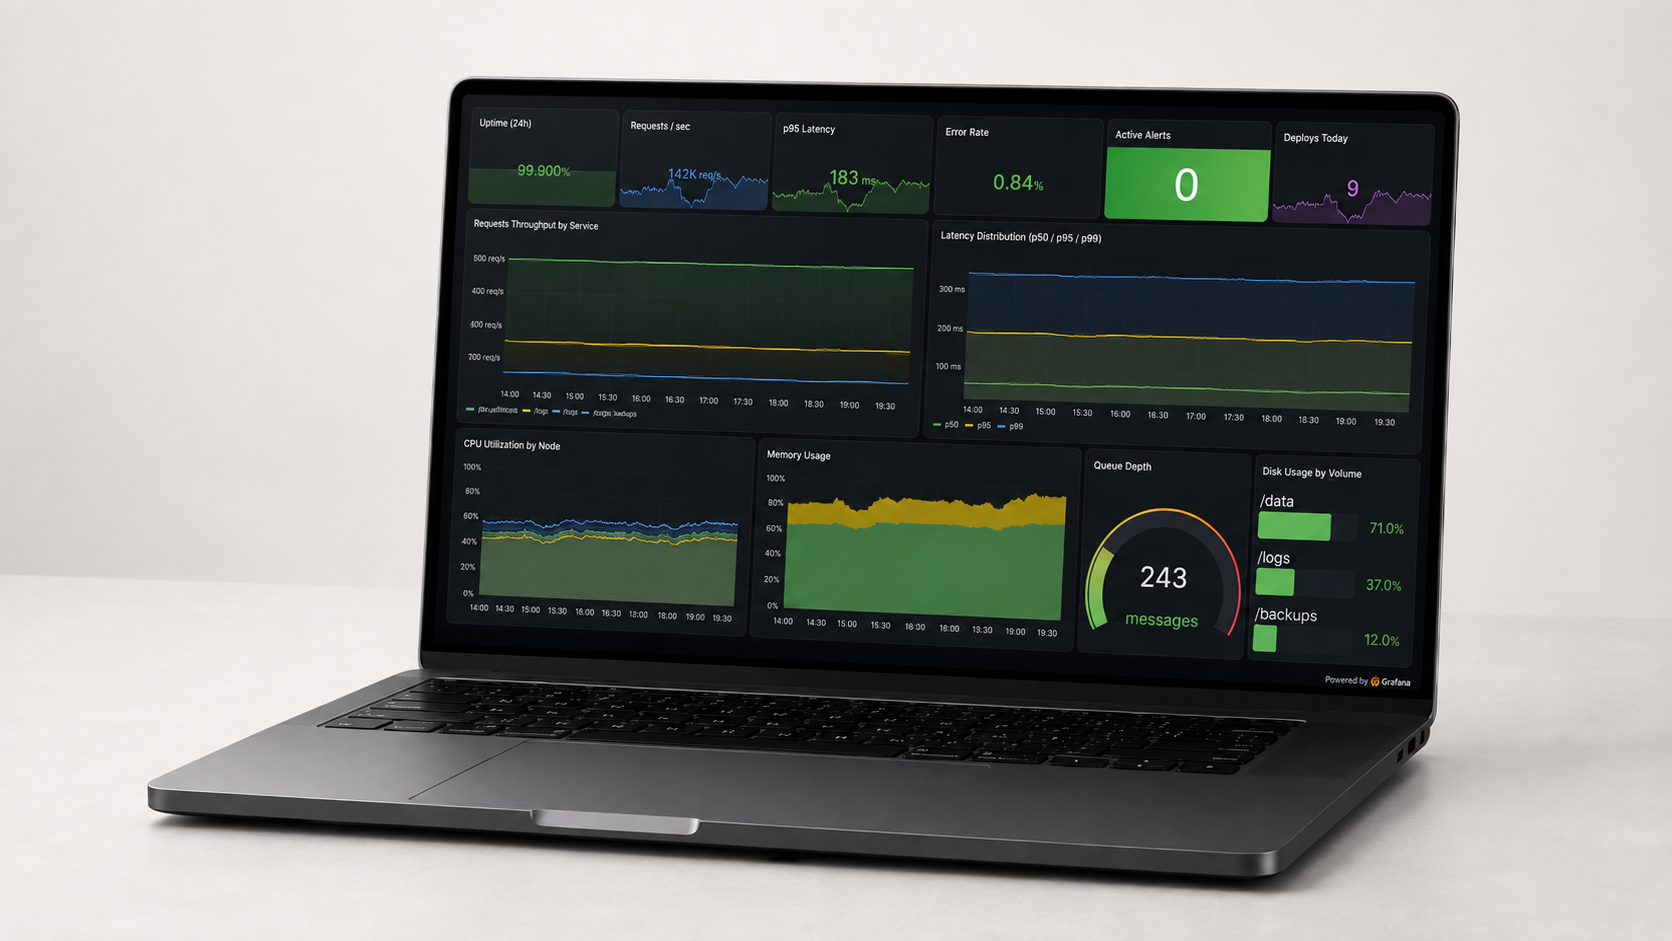
Grafana is an observability platform for building dashboards and alerts from metrics data request throughput, latency, error rates, infrastructure resource usage the kind of signal that tells you a system is degrading before a user has to file a support ticket about it.
Why It Matters
Observability that's bolted on after an incident is observability that arrives too late. Dashboards and alerting built alongside a service, not after its first outage, are what actually shorten the time between something going wrong and someone knowing about it.
How TieTech Uses It
Grafana is the observability layer behind our own production deployments, documented in detail in our observability & DevOps tooling project service health dashboards, alerting tied to on-call response, and deploy correlation so an incident starts with a timeline, not a guess.